Sourav Ghosh
Operation Analyst
Classic Fashion Apparel Ltd, Jordan
Email: souravghosh090@gmail.com
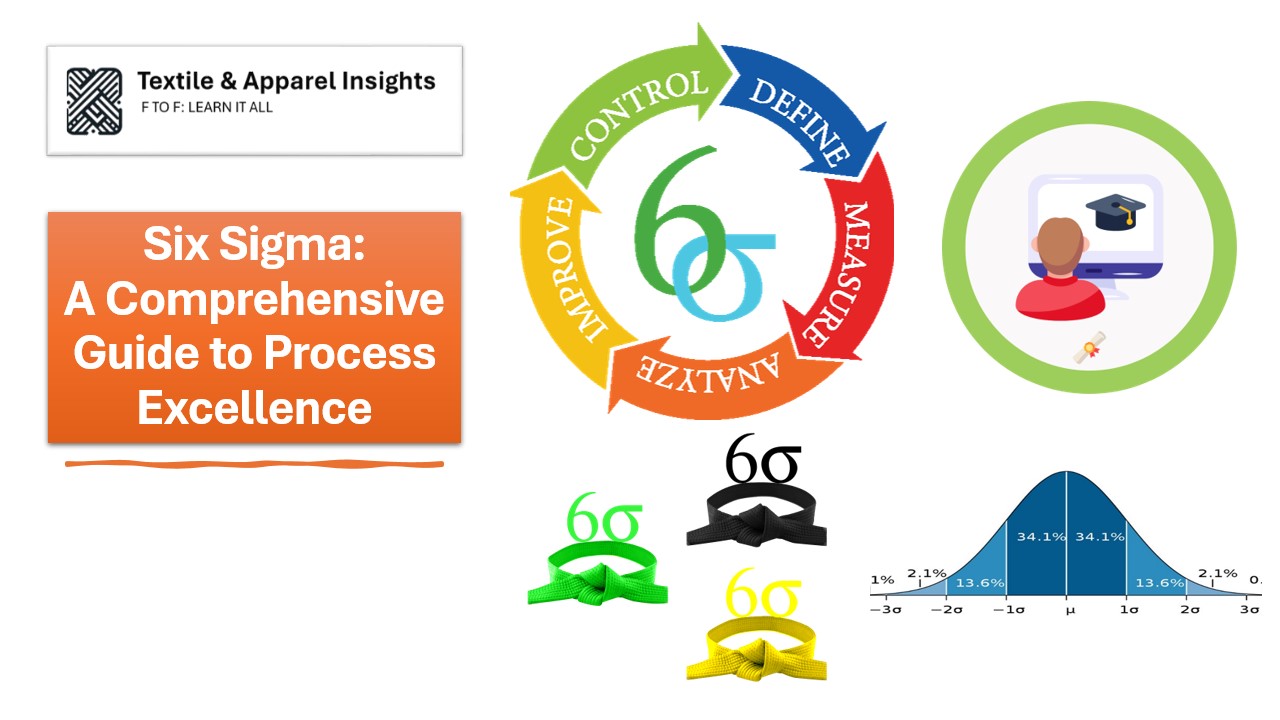
What is Six Sigma?
Six Sigma is a structured methodology that equips organizations with the tools needed to enhance the efficiency of business processes. By reducing process variability and improving performance, Six Sigma fosters defect reduction boosts profitability, elevates employee morale, and enhances the quality of products and services. The term “Six Sigma quality” refers to well-controlled processes operating within ±3 standard deviations (±3σ) from the centerline on a control chart and within ±6 standard deviations (±6σ) from tolerance limits.
Key Benefits of Six Sigma
- Improved Customer Satisfaction: Enhanced product and service quality leads to higher customer satisfaction and loyalty.
- Cost Reduction: Identifying and eliminating inefficiencies reduces waste and operational costs.
- Employee Engagement: Structured problem-solving methodologies empower employees and improve morale.
- Data-Driven Decisions: Emphasizes using statistical data for objective and effective decision-making.
- Increased Revenue: Streamlined processes and better quality products result in higher revenue and market share.
Different types of Six Sigma belt & their responsibilities
Six Sigma employs a hierarchical system of belts, each with specific roles:
- Master Black Belt: Trains and mentors Black Belts and Green Belts, sets strategic directions, develops metrics, and acts as the organization’s Six Sigma consultant.
- Black Belt: Leads problem-solving initiatives and coaches project teams.
- Green Belt: Supports data collection and analysis for Black Belt projects, and leads their own projects or teams.
- Yellow Belt: Participates in project teams and reviews process improvements.
- White Belt: Understands basic Six Sigma principles and may contribute to localized problem-solving efforts.
What are the differences between Lean & Six Sigma?
| Feature | Lean | Six Sigma |
| Origin | Japan, pre-WWII | USA, 1980s |
| Goal | Reduce waste | Reduce defects |
| Approach | Continuous improvement | Defined start and finish |
| Structure | No belts | Belt hierarchy |
| Focus | Proactive | Reactive |
| Tool Complexity | Simpler | More complex |
| Customer Impact | Faster, cheaper service | Consistent quality |
| Team Structure | Empowers whole organization | Involves expert ranks |
| Speed | Faster | Slower |
DMAIC Phases of Lean Six Sigma
Lean Six Sigma is based on the different stages those stages are DMAIC
- 1st phase: D –Define Phase
- 2nd Phase: M –Measure Phase
- 3rd Phase: A –Analyze Phase
- 4th Phase: I – Improve Phase
- 5th Phase: C –Control Phase
1. Define Phase
A. Problem Statement: Clearly articulate the problem using metrics, facts, minimal jargon, and without suggesting solutions. Example:
- Poor: “We have too much inventory and need to implement JIT.”
- Better: “The inventory of unsold cars at ABC Motor Store in Amsterdam exceeds the target of 500 units, averaging 5000 units since 2015, causing space and cash flow issues. Reducing this to the target level is expected to save INR 360 Cr annually.”

B. Project Goal: A clear project goal is required to make a project successful. Otherwise, it will cause problems in different stages of the project.
- Why project goal
- -Inform others
- -Obtain approval
- -Measure success
- The project goal should concentrate on a few measures, which are
- -What?
- -How much
- -By when
- Example:
- Poor: “Improve inventory problem at ABC Electronics.”
- Better: “Reduce mobile phone inventory at ABC Electronics by 90% before January 10, 2025.”
C. Project Charter: Outline the project name, business case, goal, team members, scope, schedule, and sponsor details.
| Project Name | |
| ABCD | |
| Business case | |
| •Problem statement/opportunity (What do we get when we solve this problem?) •Estimated costs •Risks | |
| Goal | Members |
| •You may just copy-paste your project goal here. | •Who is involved and who does what? |
| Scope | |
| •What are the boundaries of our project? For instance, your project might only apply to one region or one product. | |
| Schedule | |
| When are we planning to do what? If you have a Gantt chart, copy and paste it here. | |
| Name and position of project sponsor | Signature |
D. Critical Path Analysis: Identify tasks essential to project completion and their dependencies to streamline planning and execution.

2. Measure Phase
In a project, there will be many variables that can be measured on various scales.
- Use measurement scales:
- A. Nominal: Categories without order (e.g., nationality).
- B. Ordinal: Ordered categories (e.g., education level).
- C. Parametric: Numeric data (e.g., income).
A. Nominal Measurement Scales
- Values are words instead of numbers.
- Values can’t be put in a low-high order.
- Binary variables are always measured on a nominal scale
Example –
- What is your Nationality?
- What is the Location of the factory?
B. Ordinal
- Values are words or number ranges.
- Values can be put in a low-high order.
Example –
- What is your satisfaction level with the hotel? Rate 1 to 10, where 1 is low & 10 is high.
- What is your highest education degree?
- Options are — No college degree / Bachelor degree / Master degree / PhD degree
C. Parametric
- Values are numbers.
- Values can be put in low-high order.
Example –
- What is your age? …
- What is your monthly net $ income?
Special note;
- Ensure data aligns with the normal distribution and meets 95% or 99% confidence levels.
- Data Collection Plan: Define what data to collect, how to collect it, and ensure it is reliable and valid.
- Process Mapping: Visualize the workflow to identify inefficiencies and opportunities for measurement.
D. Normal distribution & Confidence level
When we collect the data & try to extract something meaningful, we should put the data in normal distribution & that data should show a 95% or 99% confidence level So that it will help us to make some decisions based on the data.
The collected data need to be placed in an X-Y plot & get a bell-shaped curve. This bell shape curve is known as a normal distribution curve. The normal distribution curve data is then needed to justify based on the required sigma level.
Below, we show the normal distribution curve & how to make the required sigma level from it.
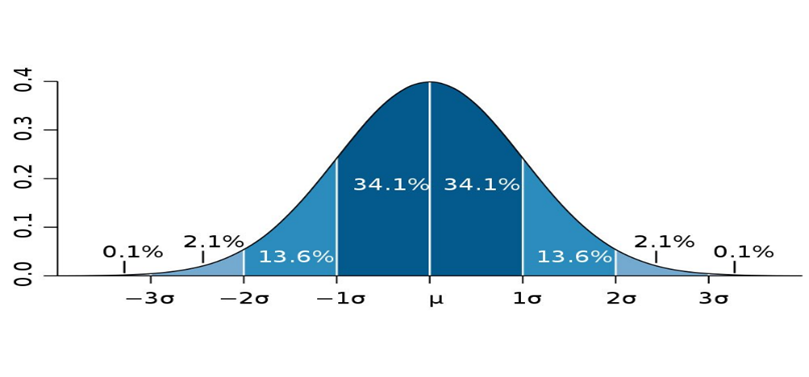
There are different sigma level
- Sigma level 2 (68% confidence)
- Sigma level 4 (95% confidence)
- Sigma level 6 (99% confidence)
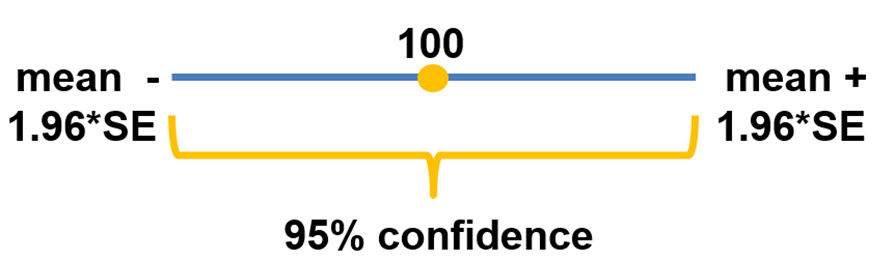
Example
95% Confidence Interval
Sample 100 soldiers
Hours at the gym per week: 100
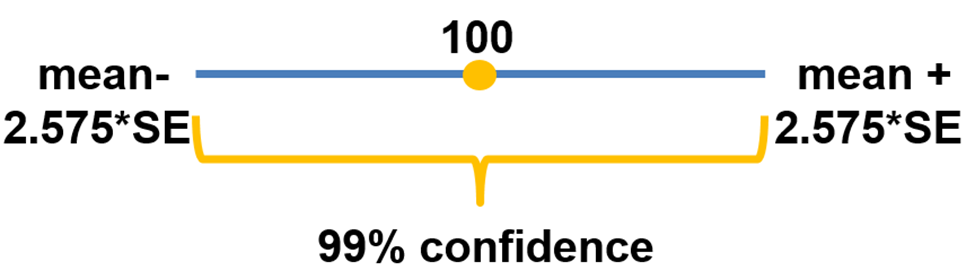
99% Confidence Interval
Sample 100 soldiers
Hours at the gym per week: 100
3. Analyze Phase
Aim: Find out the root case(s)
- A. Qualitative Tools:
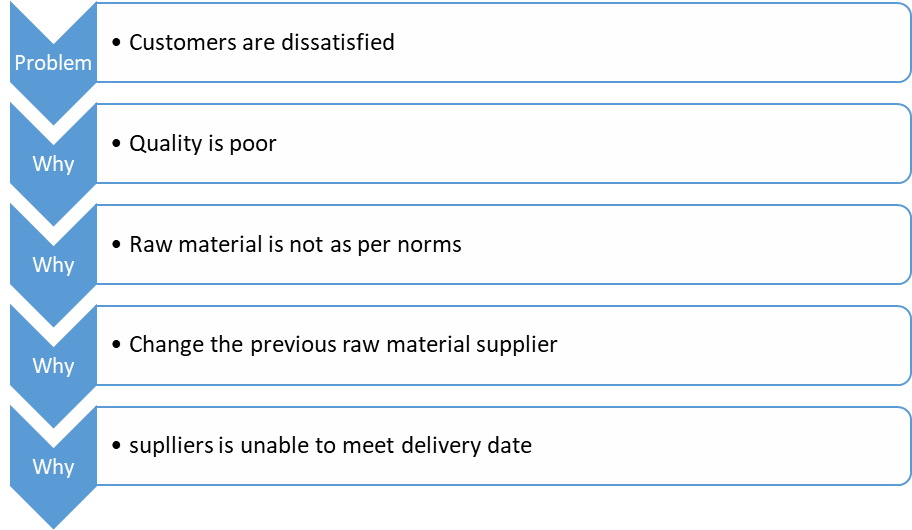
- 5 Why Analysis: A method to identify root causes by repeatedly asking “Why?”
- B. Quantitative Tools:
- Regression Analysis: Examine relationships between variables.
- Fishbone Diagram (Ishikawa): Categorize potential causes of a problem to pinpoint root issues.
- Pareto Analysis: Focus on the most significant factors contributing to a problem, following the 80/20 rule.
A. Qualitative Tools
5 Why Analysis
“5 Why Analysis”, also known as “Why Analysis”
Method for Finding Root Cause(S) In the Analysis Phase of DMAIC
B. Quantitative Tools
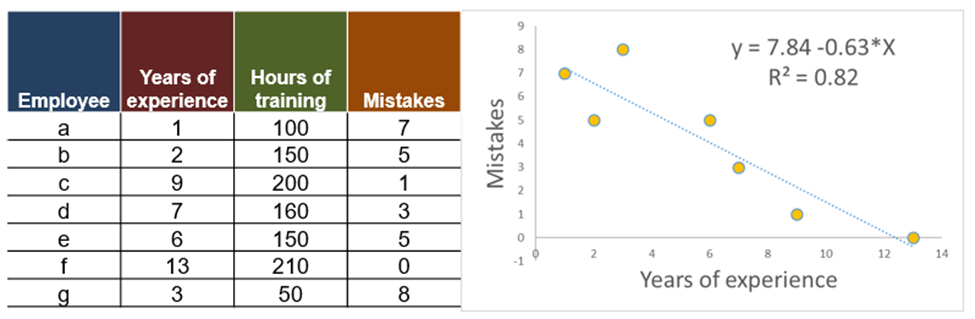
Single OLS (Ordinary Least Squares regression) regression
- Quantify the effect of 1 independent variable (X) on 1 dependent variable (Y). Y = a + b*X
Multiple OLS regression
- Quantify the effect of several independent variables (Xs) on 1 dependent variable Y. Y = a + b1*X1 + b2*X2 …+ bn*Xn
Single OLS –Mistakes = 11.6 – 0.05 * hours training
Single OLS –Mistakes = 7.84 – 0.63 * years experience
Multiple OLS –Mistakes = 10.72 – 0.28 * years experience – 0.04 * hours training
4. Improve Phase
We have reached to the improvement phase. The in which we seek a solution to our problem. Since we can have countless problems of various natures, we can have countless solutions of various natures. We thus present you with a number of tools/theories which may help you in your quest for a solution. Please note that you do not have to use them all in every project.
The following tools shall be presented:
- FMEA (or Failure Mode and Effect Analysis): This tool assesses product, service, and process risks. It furthermore sheds more light on the root causes and helps you to prioritize your improvements.
- Theory of constraints: If your problem has something to do with a process that is too slow, this theory will help you to speed up your processes. This theory is suitable for manufacturing and services.
- DOE: This will help you test various possible solutions to see which is the best.
- QFD: This tool is great if your solution involves a (re)design of a product or service. This tool is tremendously valuable in the (re)design process.
- 20-60-20 Rule: This is used during change implementation to choose a focus and deal with opposition. We decided not to present this tool as just perfect but as a tool with pros and cons. We stimulate you to make up your own mind. Feel free to experiment in real life.
- RACI Matrix: The improvement phase is not just about formulating a solution. It actually involves deploying your solution. This can become quite a project by itself. Although situations differ, in our experience, 4-5 people are needed to fully clear the Improve phase in most cases. But who does what? Who has which role? The RACI Matrix may help you with that.
- Pilot Testing: Test proposed solutions on a smaller scale before full deployment.
- Stakeholder Engagement: Involve stakeholders early to ensure alignment and support for the changes.
5. Control Phase
We have reached the last phase of the Six Sigma DIMAC principle; in the control phase, we have to make sure the solution is sustained in day-to-day operations. Otherwise, we will come back to the previous condition.
The solution might be neglected, poorly implemented, forgotten or sabotaged. In the control phase, we try to prevent that and ensure that we stay in the control phase of the solutions.
There are a few steps that will ensure that implemented improvement stays in the same place; those are
- Audit
- Visual control
- Dashboard
- Standard Operating Procedures (SOPs)
- Training and Communication
- Monitoring Systems
Conclusion
Six Sigma is a powerful methodology that drives operational excellence by minimizing defects and process variability. By adopting the DMAIC framework and leveraging Lean principles, organizations can achieve faster, cost-effective, and high-quality outcomes. The systematic belt system ensures structured learning and expertise, enabling teams to tackle challenges with precision and strategic focus. As industries evolve, Six Sigma remains a cornerstone for continuous improvement and business success.
References
About the Author: Sourav Ghosh is a graduate of Govt. College of Engg. & Textile Technology, Serampore, West Bengal. Where he pursued his Bachelor's degree in textile Engineering. He worked with prestigious companies like Arvind Mills ( Ahmedabad) & Coats India ( Bangalore) in fabric development. He completed his Masters degree from the National Institute of Fashion Technology (New Delhi). Currently, he works as an Operations Analyst at Classic Fashion Apparel Ltd (Jordan).
can i purchase clomiphene without rx where to get clomiphene without dr prescription can i order cheap clomiphene for sale buying generic clomiphene tablets cost cheap clomid prices how to get cheap clomid pill how to buy generic clomiphene pill
I’ll certainly bring to review more.
More articles like this would remedy the blogosphere richer.
buy zithromax pills for sale – ofloxacin 400mg cost flagyl online order
brand semaglutide 14mg – semaglutide brand order cyproheptadine 4 mg pill
motilium tablet – generic motilium cyclobenzaprine 15mg usa
inderal 10mg us – buy inderal buy methotrexate pills
purchase amoxil – amoxicillin tablets ipratropium 100 mcg pill
Самоуважение психология. Психолог онлайн отзывы. Сайт психологической помощи.
Психологи онлайн. Поговорить по душам онлайн. Самоуважение психология.
zithromax 500mg cheap – buy tinidazole pills bystolic where to buy
buy augmentin 1000mg online – https://atbioinfo.com/ ampicillin usa
order generic nexium – https://anexamate.com/ how to buy esomeprazole
warfarin canada – https://coumamide.com/ purchase hyzaar generic
meloxicam 7.5mg usa – https://moboxsin.com/ meloxicam 15mg sale
order deltasone pill – https://apreplson.com/ order prednisone 20mg pill
cheap erectile dysfunction pills online – fast ed to take buy ed pills tablets
buy amoxicillin pill – https://combamoxi.com/ amoxil brand
Майнинг Фармилки – это игры на блокчейне, где игроки могут зарабатывать криптовалюту, участвуя в игровом процессе, развивая своих персонажей или владея виртуальными активами.
https://emiratesambassadeurs.com/vip-concierge/ Need Aquanaut 5269R in Geneva? our Geneva-based private watch desk can quote and share a confirmed quote with full set confirmed.
Your article helped me a lot, is there any more related content? Thanks!
bs2we at
морозы Волгоград Новости Волгограда сегодня: оперативно и по делу. Главные события, срочные сообщения и криминальная хроника.
https://www.iraqnews.net/newsr/15838
кайтсёрфинг кайтинг
http://devec.ru/content/blog/promokod-na-1xbet.html
bs2we at
лазерный принтер каталог (Лазерный принтер – идеальное решение для быстрой и четкой печати документов. | Лазерные принтеры превосходят струйные по скорости и экономии тонера. | Хотите лазерный принтер купить? Широкий выбор моделей по доступным ценам! | Лазерные принтеры купить легко в нашем магазине с гарантией качества. | Купить лазерный принтер – значит инвестировать в надежность и производительность. | Заказать лазерный принтер онлайн – быстро и без лишних хлопот. | Лазерный принтер цена радует: от 5000 руб. за базовые модели. | Узнайте лазерный принтер стоимость – выгодные акции для всех покупателей. | Ищете лазерный принтер недорого? У нас лучшие предложения! | Лазерный принтер купить недорого – реальность с нашими скидками до 30%. | Дешевый лазерный принтер не уступает по качеству печати. | Бюджетный лазерный принтер для дома и офиса – оптимальный выбор. | Лазерный принтер купить онлайн в 2 клика с доставкой. | Заказать лазерный принтер онлайн – удобный сервис 24/7. | Лазерный принтер интернет магазин с тысячами отзывов. | Интернет магазин лазерных принтеров – ваш надежный партнер. | Лазерный принтер каталог: фото, характеристики, отзывы. | Лазерный принтер в наличии – забирайте сегодня! | Лазерный принтер с доставкой по России бесплатно от 5000 руб.)
дешевые путешествия гейминг
заказать аудиоролик Заказать аудиорекламу онлайн: экономьте время и бюджет на студийной записи.
bs2best at
тарифы интернета мегафон Установка домашнего интернета и Wi-Fi может быть осуществлена как самим провайдером, так и пользователем, обеспечивая бесперебойный доступ к сети.
продвижение сайтов сео продвижение сайтов сео
http://studenternas.nu
трансы воронеж В мире клубной культуры транс (trance) — это не просто музыкальный жанр, а целое состояние души, погружающее в гипнотический ритм и мелодичные переливы.
ко ланта на карте ко ланта что посмотреть
стримы свирыча Поэтому, когда речь заходит о “вайбовых” стримах, имя SWeAR2033 неизменно всплывает в числе первых, являясь синонимом отличного времяпрепровождения в интернете.
заказать кухню из массива дерева Наша цель — показать, что «алгоритмы» могут быть не только функциональными, но и элегантными, «вкусными» и захватывающими.
кайт школа в крыму кайт школа
https://topsitenet.com/profile/betfreebets1/1546934/
https://muhammad-ali.com.az/user/marrenntrx
рейс луганск москва расписание автобусов
кайт кайт школа в крыму
крипта для чайников Крипта, майнинг, аирдропы и тапалки — всё самое свежее в Smart Money Crypto Зарабатывай на криптоиграх и фармилках прямо в Telegram. Пассивный доход с удовольствием и без вложений! Заходи и забирай свою прибыль. ИЛИ Ищешь где заработать на крипте? Smart Money Crypto Новости, криптоигры с выводом, актуальные аирдропы и майнинг на телефоне. Тапалки и фармилки в Telegram для твоего пассивного дохода. Присоединяйся к команде Smart Money!
https://pixel.tchncs.de/prmovalide
Астане
casino mafia Decouvrez Mafia Casino avis 2026 : site officiel avec connexion securisee, bonus exclusifs, milliers de jeux et retraits rapides. Inscrivez-vous des maintenant!
https://fkwiki.win/wiki/Post:Code_promo_1XBET_Bonus_jusqu_130_1X200RED
программа электронной очереди
безплатные знакомства Сайт знакомств бесплатно — это демократичный оазис для искателей романтики, где без финансовых преград расцветают бутоны новых романов и крепких дружб. Бесплатные знакомства открывают двери для всех, кто верит в чудо случайной встречи в цифровой вселенной.
https://doskazaymov.kz/ Если у вас несколько кредитов и займов МФО, Досказаймов в Актобе помогает посчитать переплату перекредитование и получить более понятный график выплат.
Казино Vavada привлекает игроков щедрыми бонусами без депозита и постоянными турнирами с крупным призовым фондом.
Регистрация занимает несколько минут, а рабочие зеркала обеспечивают стабильный доступ к сайту даже при блокировках.
Проверяйте актуальные промокоды и условия отыгрыша, чтобы оптимально использовать стартовые фриспины.
Служба поддержки отвечает на русском языке и помогает решить вопросы с верификацией и выводом средств.
Свежие предложения и актуальное зеркало доступны по ссылке: https://vluki.net/vavada.
Играйте ответственно и контролируйте банкролл, чтобы азарт приносил удовольствие.
проект производства работ при капитальном ремонте Ключевым моментом является то, что проект производства работ на строительство утверждается ответственными лицами, включая руководителя организации и, при необходимости, заказчика, что подтверждает его соответствие всем нормам и требованиям.
борьба с тараканами Профессиональная дезинсекция тараканов, включая обработку инсектицидным туманом, является одним из самых надежных способов быстро и эффективно устранить заражение, обеспечивая долгосрочный результат и спокойствие в вашем доме.
накрутка лайков вк быстро Живая накрутка вк бесплатно, накрутка лайков вк без заданий, продвижение через вк — эти методы требуют более вдумчивого подхода, но могут принести более долгосрочную выгоду.
английский для дошкольников
казино лев бонусы Игрокам доступно как демо-режим для ознакомления с играми, так и игра на реальные деньги с возможностью вывода средств, что подтверждается многочисленными положительными отзывами игроков.
кредит под залог машины Получение кредита под залог недвижимости — это возможность получить значительную сумму денег на выгодных условиях, используя ваш дом, квартиру или земельный участок в качестве обеспечения.
ии для компаний Использование нейросетей и продвинутых алгоритмов в создании ИИ-ассистентов позволяет им обучаться и адаптироваться к изменяющимся условиям, что делает их незаменимыми помощниками в современном деловом мире.
психотерапевт онлайн консультация Профессиональное выгорание, будь то в бизнесе, на руководящих позициях или на обычной работе, является серьезной проблемой, требующей своевременной психотерапевтической помощи. Специализированные программы, направленные на профилактику и лечение синдрома выгорания, помогают восстановить эмоциональное равновесие и предотвратить дальнейшие негативные последствия.
официальный king casino Получите доступ через зеркало, воспользуйтесь бонусами и фриспинами, и начните играть прямо сейчас.
https://www.pianational.org/home/default
Металлоконструкции для ЛЭП Трубы ПВХ и ПНД, благодаря своей химической стойкости и гибкости, широко используются в системах водоснабжения и канализации, а различные виды запорной арматуры, такие как задвижки стальные и чугунные, клапаны обратные, затворы чугунные и стальные, краны шаровые и вентили, обеспечивают надежное управление потоками. Компенсаторы поглощают тепловое расширение трубопроводов, предотвращая их повреждение
https://uniquesystems.online/code-promo-1xbet-2026-1xburn-bonus-gratuit-130-e/
bs2web at bs
https://uncledocscardcloset.com/code-promo-1xbet-vip-2026-1xburn-130-e/
https://t.me/SystemFlowBot?start=tdvideo_prm_213298_179003 Когда ты готов оставить сомнения позади и решиться на полный переворот в жизни – переходи по указанному адресу.
ps4 греется в одинцово Мы предлагаем срочный ремонт компьютеров, ремонт ноутбуков, ремонт телевизоров, ремонт телефонов, ремонт принтеров, ремонт игровых приставок в Одинцово по выгодной цене.
https://demo.jcow.net/blogs/viewstory/107591
https://www.mncppcapps.org/planning/publications/publication_download.cfm?filepath=http://petrem.ru/tehnologiya-ukladki-keramicheskoy-plitki-na-stenu/
bs bs2web at
I don’t think the title of your article matches the content lol. Just kidding, mainly because I had some doubts after reading the article.
https://bookshop.org/wishlists/465ef98e153e9dec2e6c8d46b47c2c9702f17270
bs2 marketplace bs2web at
https://forumposting.proboards.com/thread/2084/best-promo-1xbet-allinmax-bonus
kraken marketplace slon3 at
сигнализация на авто Приобрести автосигнализацию в комплексе с установкой – значит получить готовое решение под ключ, избавившись от лишних хлопот и гарантировав полную работоспособность выбранной вами системы. Покупка автосигнализации с обратной связью и функцией автозапуска – это современный подход к обеспечению безопасности, позволяющий контролировать состояние автомобиля на расстоянии и запускать двигатель в удобное для вас время.
kraken marketplace slon3 at
Сигнализация c автозапуском на Lexus RX Охранная система и сигнализация c автозапуском была установлена на Лексус RX в нашем установочном центре.
kraken market актуальная ссылка slon3 at
kraken krab оффициальная ссылка kra3 at
какой промокод на 1хбет на сегодня
https://grktmn.ru/includes/pages/promokod-1xbet_na_segodnya.html
https://npkmir.ru/user/dernesihqq
глэмпинг дом аренда
https://tv-ekran.ru/user/pherahbmtk
https://www.nicovideo.jp/my
https://myhealthcommunity.mn.co/posts/xbet-promo-code-for-free-bet-1x200elite-%E2%82%AC130-free
bs2 marketplace bs2web at
домашний интернет акции
новости криптовалют
Умный газовый счетчик Умные счетчики, включая электросчетчики, предлагают более продвинутые функции для мониторинга и управления ресурсами.
Заземление в частном доме Севастополь
Thank you for your sharing. I am worried that I lack creative ideas. It is your article that makes me full of hope. Thank you. But, I have a question, can you help me?